The cryptocurrency market is having a poor start to the week after an underwhelming performance over the weekend. Bitcoin briefly dropped below the $88k level after losing 1.2% of its value.
Ether, the second-largest cryptocurrency by market cap, also dropped below $2,900 as it is down 2% over the weekend.
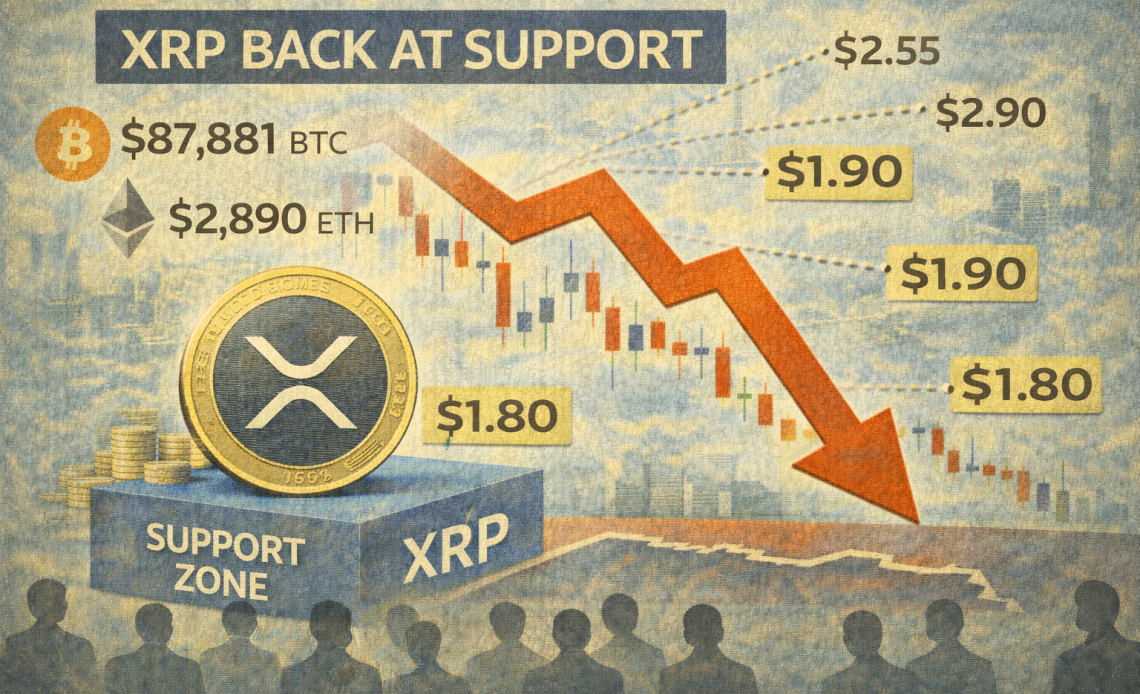
Meanwhile, XRP, the native coin of the Ripple ecosystem, is recovering from its dip and now eyes the $1.9 level.
XRP defends the $1.80 support level
XRP retested the $1.80 support level on Sunday, recording a 48% pullback from the $3.66 high it recorded in July 2025.
The cryptocurrency is currently back at its 1-year central demand base, while RSI divergence and cycle timing show that the market conditions remain weak.
In recent weeks, XRP has been rotating into a 1-year central demand zone between 2.21 and 1.85.
This demand zone sits at the midpoint of the broader 1-year structure and has previously acted as a launch base for major upside cycles.
If the demand zone holds in the near term, XRP could rally towards a new all-time high, as witnessed in June 2025.
The trading volume remains thin, indicating that retail traders are not interested in XRP’s near-term price action.
However, RSI divergence is developing, suggesting downside pressure may be slowing at a key structural level.
In addition to that, Trend-Based Fibonacci Time is also aligning with a potential cycle window, suggesting that the bulls could regain control in the near term.
XRP’s setup is similar to Bitcoin, which is currently trading around a central pivot decision point, placing multiple crypto majors near key inflexion zones.
If the current demand zone holds, XRP could rally towards new supply zones at $2.55, $2.90, and $3.25, and the prior peak region near $3.60–$3.66.
However, if the demand zone fails, XRP is staring down lower support levels below $1.50.
XRP eyes $1.90 as daily support holds
The XRP/USD 4-hour chart remains bearish as Ripple has underperformed over the past few days.
The price corrected by more than 12% over the last three weeks since early January, retesting the daily support at $1.81 on Sunday.
However, it has rebounded slightly and is now trading at $1.88 per coin.
If the daily support holds, XRP could extend its recovery towards the next daily resistance at $1.96 in the near term.
Similar to Bitcoin and Ether, XRP’s momentum indicators show that the 4-hour chart remains bearish.
The RSI of 43 is below the neutral 50, suggesting that the bears are still in control.
The MACD lines are also within the negative zone, adding further bearish confluence to the pair.
However, if the recovery fails and XRP closes its daily candle below the $1.81 support, it could extend the decline toward the December 19 low of $1.77.
The post XRP eyes $1.9 after defending the $1.8 support level: Check forecast appeared first on Invezz